The product
Correlation-first incident tooling for platform teams
Infrawatch doesn't collect signals — it connects them. By the time the on-call page fires, the causal chain is already mapped: which config changed, which pod died, which latency tail moved first.
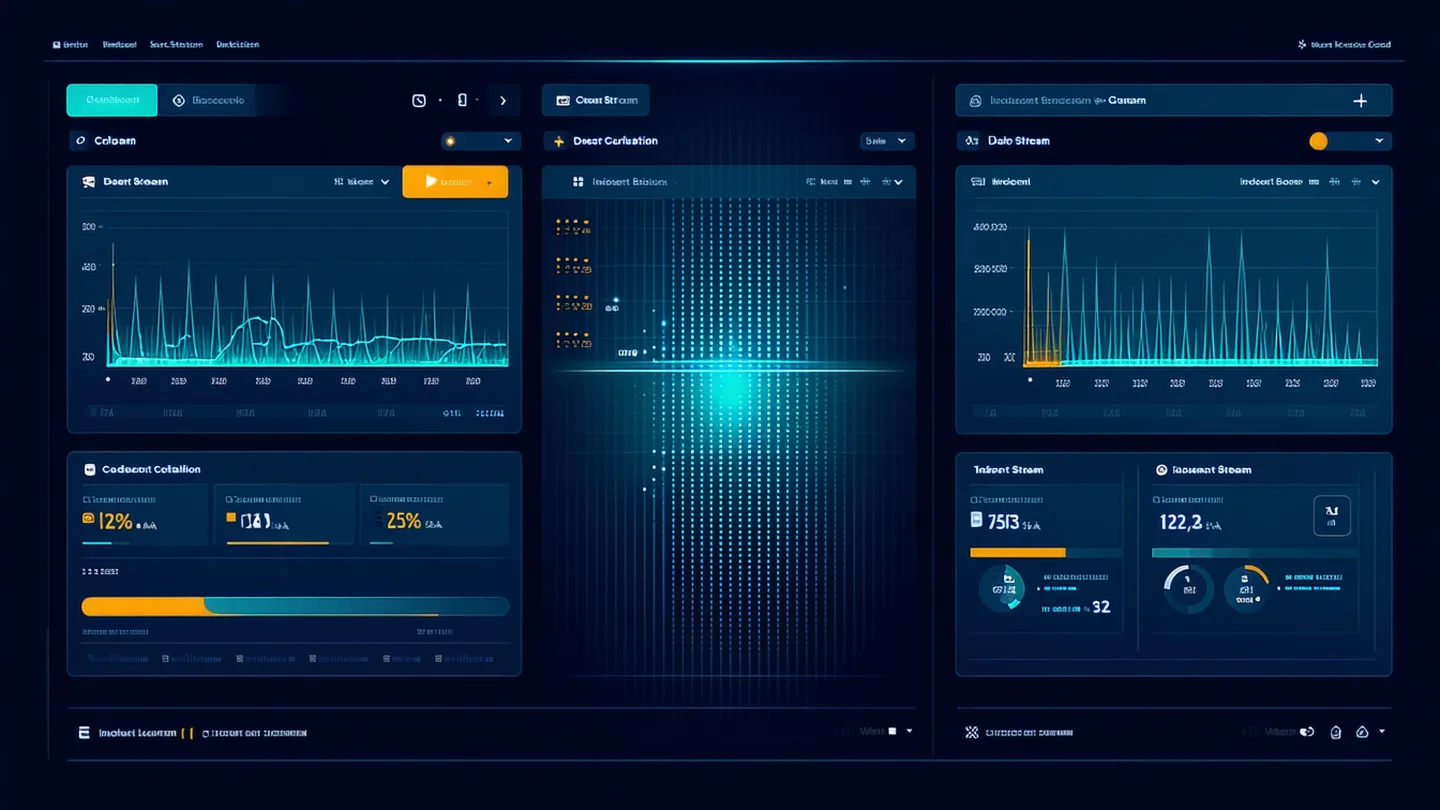
The incident correlation view
Three signal streams. One incident card. Full causal context.
Correlation engine
Topology-aware signal correlation
Infrawatch's correlation graph doesn't treat every alert as an independent event. It builds a live service topology from your OTel resource attributes and Kubernetes namespace labels — so when a cache pod OOMKills and three downstream API services see p99 spikes within the same correlation window, they're grouped into one incident candidate, not four separate pages.
- Configurable correlation window (5m default, tunable 30s – 60m per cluster)
- Service mesh topology ingestion via OpenTelemetry resource attributes
- Namespace and label-based topology inference for Kubernetes environments
- Weighted confidence scoring per correlation cluster — shown on the incident card
Alert deduplication
Kill the alert fatigue before it reaches your queue
When Prometheus, Datadog, and Alertmanager all fire simultaneously for the same underlying condition, the alert storm is itself the incident. Infrawatch deduplicates identical and correlated alerts across all sources before they route to PagerDuty or Slack — so one root cause generates one page, not four redundant wakeups.
- Multi-source deduplication (Prometheus + Datadog + Alertmanager)
- Configurable similarity window and topology matching rules
- Deduplication audit log per incident for post-mortems
Incidents processed:    142
Raw alert count:       618
Deduplicated down to:  142 unique incidents

── dedup ratio: 4.35× ──

Top dedup sources:
  · datadog+alertmanager overlap  31%
  · prometheus+cloudwatch same metric  28%
  · k8s event cascade  41%
Config change tracking
Every config change, fingerprinted to the incident
Helm chart upgrades, Terraform applies, ArgoCD syncs, and Kubernetes ConfigMap diffs are the most undertracked cause of production incidents — because most monitoring tools index on metrics and events, not on what changed in your config pipeline. Infrawatch fingerprints every config event and links it to the incident timeline automatically. The question shifts from "what changed?" to "confirm that's the one."
- Helm chart change detection (multi-document release support)
- Terraform apply tracking via webhook or log forwarding
- Kubernetes ConfigMap + Secret change diffing
- ArgoCD sync event integration
config change detected  T-8m before incident

chart: payments-worker v2.3.1 → v2.4.0
namespace: payments-prod
changed keys:
  resources.limits.memory: 512Mi → 256Mi
  env.WORKER_POOL_SIZE: 4 → 8

correlation confidence: 0.91
pattern seen: 3 of last 3 OOMKills
Ready to see it on your stack?
14-day Platform trial. No credit card.
We onboard platform teams running 50+ services. You'll see a correlated incident in your own environment the same day.