About
We're the correlation layer your observability stack is missing

Started in 2022, after one too many 3am war rooms
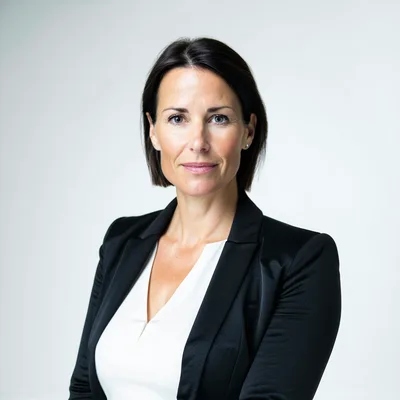
Amara Osei spent five years building observability stacks at infrastructure companies in Chicago. Every major incident followed the same script: Prometheus fired, Datadog fired, Slack exploded, and three engineers were pulled into the same war room — each starting their investigation from a different alert, none of them seeing the full picture.
In mid-2022, after a particularly expensive Friday night incident that had a single root cause (a Helm memory limit change three hours earlier) that every monitoring tool saw but none connected, Amara started prototyping a correlation layer. Not another metrics collector. Not another dashboard. A tool that would read the signals you already have and show you the causal chain before engineers start duplicating work.
The first version ran on her laptop and was pointed at a friend's staging cluster. By October 2022, it was running in one production environment. When other platform engineers saw the incident diff — three separate alerts collapsed into one correlated card with the config change attached — they asked to use it. That's when it became a company.
Infrawatch is bootstrapped. We grow by building something platform engineers actually reach for on the worst nights.
"Every tool in your stack saw the incident coming. None of them talked to each other. That's the problem we're fixing."— Amara Osei, CEO & Co-Founder
The team
Four engineers. Each one has been on-call.

Five years building observability infrastructure at platform engineering orgs before co-founding Infrawatch in 2022. Wrote the first version of the correlation engine. Handles every early access onboarding call personally.
Distributed systems engineer with a background in stream processing and graph databases. Designed the correlation graph engine that handles the real-time topology matching at the core of Infrawatch.
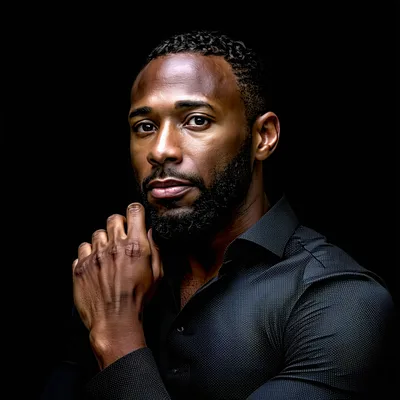
Led platform engineering at a logistics technology company before joining Infrawatch. Spent three years on the on-call rotation he now helps others fix. Owns product direction and customer discovery.

Systems programmer with deep background in time-series storage and OTLP pipeline design. Owns the ingestion layer and OTLP compatibility. Previously contributed to open-source Prometheus exporters.
How we build
Three lines we hold
Fewer signals, better quality
Infrawatch must reduce alert volume, not add to it. If a feature doesn't improve the signal-to-noise ratio for the on-call engineer, it doesn't ship. We decline feature requests that add dashboards for their own sake.
Correlation layer, not a platform replacement
We're not building a metrics database, a tracing backend, or a log aggregator. Your Prometheus remote_write stays. Your Grafana alerts stay. We sit between your existing signal sources and your on-call queue — and that's the full scope.
Every customer gets a founder on their first call
Every early access customer runs through onboarding with Amara or Kwame. Not a support ticket, not a tutorial video. We do this because every incident pattern we see in the wild improves the correlation engine. We ship every 2–3 weeks.
Work with us
We hire slowly. We'd rather be 4 people doing it right.
No open roles right now, but we're always interested in engineers who have strong opinions about incident tooling built from real on-call experience. Say hello if that's you.